pygmt.Figure.basemap
- Figure.basemap(projection=None, zsize=None, zscale=None, frame=False, region=None, map_scale=None, compass=None, rose=None, verbose=False, panel=False, transparency=None, perspective=False, **kwargs)
Plot base maps and frames.
Creates a basic or fancy basemap with axes, fill, and titles. Several map projections are available, and the user may specify separate tick-mark intervals for boundary annotation, ticking, and [optionally] gridlines.
At least one of the parameters
frame,map_scale,rose, orcompassmust be specified if not in subplot mode.See also the following methods that provide higher-level interfaces to the GMT’s
basemapmodule:pygmt.Figure.scalebar: Add a scale bar on the plot.:meth:``pygmt.Figure.directional_rose`: Add a directional rose on the plot.
pygmt.Figure.magnetic_rose: Add a magnetic rose on the plot.
Full GMT docs at https://docs.generic-mapping-tools.org/6.6/basemap.html.
Aliases:
F = box
f = coltypes
B = frame
J = projection
Jz = zscale
JZ = zsize
L = map_scale
R = region
Td = rose
V = verbose
c = panel
p = perspective
t = transparency
- Parameters:
projection (
str|None, default:None) – projcode[projparams/]width|scale. Select map projection.zscale/zsize – Set z-axis scaling or z-axis size.
region (str or list) – xmin/xmax/ymin/ymax[+r][+uunit]. Specify the region of interest. Required if this is the first plot command.
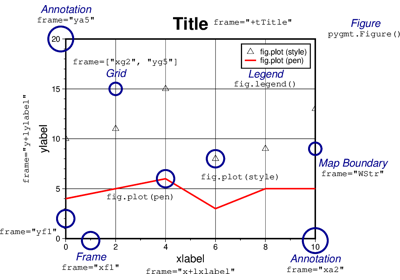
frame (bool, str, or list) – Set map boundary frame and axes attributes.
map_scale (
str|None, default:None) –Draw a map scale bar on the plot.
Deprecated since version v0.19.0: This parameter is deprecated. Use
pygmt.Figure.scalebarinstead, which provides a more comprehensive and flexible API for adding scale bars to plots. This parameter still accepts raw GMT CLI strings for the-Loption of thebasemapmodule for backward compatibility.compass (
str|None, default:None) –Draw a map magnetic rose on the map.
Deprecated since version v0.19.0: This parameter is deprecated. Use
pygmt.Figure.magnetic_roseinstead, which provides a more comprehensive and flexible API for adding magnetic roses to plots. This parameter still accepts raw GMT CLI strings for the-Tmoption of thebasemapmodule for backward compatibility.rose (
str|None, default:None) –Draw a map directional rose on the map.
Deprecated since version v0.19.0: This parameter is deprecated. Use
pygmt.Figure.directional_roseinstead, which provides a more comprehensive and flexible API for adding directional roses. This parameter still accepts raw GMT CLI strings for the-Tdoption of thebasemapmodule for backward compatibility.box (bool or str) – [+cclearances][+gfill][+i[[gap/]pen]][+p[pen]][+r[radius]][+s[[dx/dy/][shade]]]. If set to
True, draw a rectangular border around the map scale or rose. Alternatively, specify a different pen with +ppen. Add +gfill to fill the scale panel [Default is no fill]. Append +cclearance where clearance is either gap, xgap/ygap, or lgap/rgap/bgap/tgap where these items are uniform, separate x and y, or individual side spacings between scale and border. Append +i to draw a secondary, inner border as well. We use a uniform gap between borders of 2 points and the MAP_DEFAULTS_PEN unless other values are specified. Append +r to draw rounded rectangular borders instead, with a 6-points corner radius. You can override this radius by appending another value. Finally, append +s to draw an offset background shaded region. Here, dx/dy indicates the shift relative to the foreground frame [Default is"4p/-4p"] and shade sets the fill style to use for shading [Default is"gray50"].verbose (bool or str) – Select verbosity level [Full usage].
panel (
int|Sequence[int] |bool, default:False) –Select a specific subplot panel. Only allowed when used in
Figure.subplotmode.Trueto advance to the next panel in the selected order.index to specify the index of the desired panel.
(row, col) to specify the row and column of the desired panel.
The panel order is determined by the
Figure.subplotmethod. row, col and index all start at 0.coltypes (str) – [i|o]colinfo. Specify data types of input and/or output columns (time or geographical data). Full documentation is at https://docs.generic-mapping-tools.org/6.6/gmt.html#f-full.
perspective (
float|Sequence[float] |str|bool, default:False) –Select perspective view and set the azimuth and elevation of the viewpoint.
Accepts a single value or a sequence of two or three values: azimuth, (azimuth, elevation), or (azimuth, elevation, zlevel).
azimuth: Azimuth angle of the viewpoint in degrees [Default is 180, i.e., looking from south to north].
elevation: Elevation angle of the viewpoint above the horizon [Default is 90, i.e., looking straight down at nadir].
zlevel: Z-level at which 2-D elements (e.g., the map frame) are drawn. Only applied when used together with
zsizeorzscale. [Default is at the bottom of the z-axis].
Alternatively, set
perspective=Trueto reuse the perspective setting from the previous plotting method, or pass a string following the full GMT syntax for finer control (e.g., adding+wor+vmodifiers to select an axis location other than the plot origin). See https://docs.generic-mapping-tools.org/6.6/gmt.html#perspective-full for details.transparency (float) – Set transparency level, in [0-100] percent range [Default is
0, i.e., opaque]. Only visible when PDF or raster format output is selected. Only the PNG format selection adds a transparency layer in the image (for further processing).
Examples using pygmt.Figure.basemap


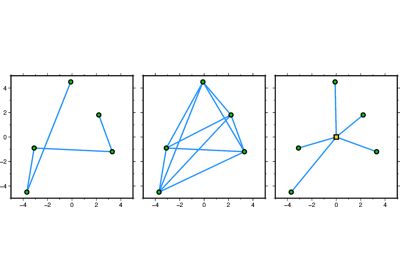

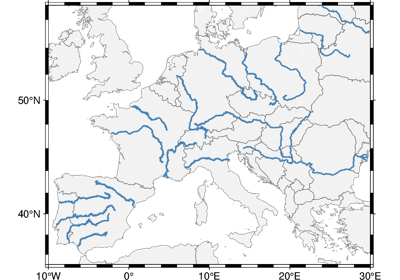
GeoPandas: Plotting lines with LineString or MultiLineString geometry
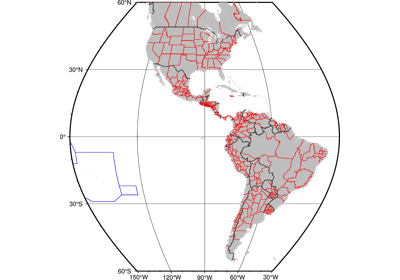


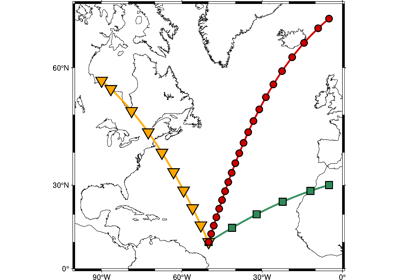
GeoPandas: Plotting points with Point or MultiPoint geometry